The average website these days is a collage of CMS-Driven content, rich media and social media updates; users can interact with its pages in so many more ways than simply navigating to a page and reading the content.
With more Flash, more media and more javascript functionality per page, the overall user experience has improved, but has also potentially created gaps in correct measurement of the experience.
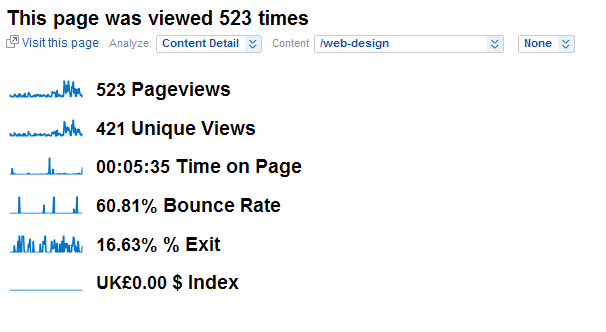
5 minutes of what?
Without customising your Google Analytics scripts or dashboard in any way, the screenshot below may look familiar. The average time on a given page seems high but the bounce rate (the percentage of users who visit just this page then leave) is high as well.

So wait, hold on a minute, we’re getting mixed messages here. Did the average user like the site or not? What on earth were they doing for 5 minutes?
The missing link
Rich media can be a useful vehicle for promoting content that normally resides at lower levels of a website’s Information Architecture. At Nomensa, we’re currently using a type of carousel, and many other sites use similar concepts. The content within these leading propositions is editorially controlled and so can change whenever is needed. This is excellent for the user experience but it creates a headache for analysts looking to measure user journeys, magnified by the fact that although a site may have a carousel at the moment, it’s by no means a permanent feature.
Google Analytics events and virtual page views
Thankfully, we can prevent these gaps in measurement by using Google Analytics Events and Pageviews. For this demonstration, I will be using JQuery to tie everything together.
Some of the questions that we’re looking to answer are:
How well does the Nomensa carousel promote content?
And
What are the most popular interactions on some of the main Nomensa landing pages?
Measuring the propositions
As mentioned earlier, the propositions on a page or even the components for displaying these propositions may change as the site evolves. As analysts we need to know how successful each particular proposition has been and how the proposition affects the user’s journey.
For the example below, we’re using JQuery to create a virtual Pageview with Google Analytics.
The simple example above targets all the links within the propositions on the web-design page of Nomensa and registers a click event that will fire off the virtual page view:
var link = pageTitle + '/Carousel/' + propTitle;
This virtual page view also includes reference to the Carousel which allows us to find out how the Carousel affected or improved user journeys in the site. With this simple script, we are in a much better position to measure how useful the Carousel is and which propositions on which pages create the most leads.
Measuring user interactions
Google’s In-Page Analytics highlights click events but are often misleading:

At first glance, you may think that users appear to generally click on each of the ‘1,2,3,4’ with each appearing to have 18% of the clicks. It may be misleading to some, but Google’s In Page Analytics is actually highlighting that, “when on this page, 18% of users have clicked one of the several links that share the same destination”. In this case, this link is for javascript interaction rather than page navigation; the link destination is the same as the page we’re on.
 The dotted border indicates this link is one of several with the same destination on a given page;
 The solid border indicates this link is the unique link to a destination on a given page.
I’ve seen a few people caught out by this feature from In-Page Analytics, but it is the javascript component that is undermining this type of report.
In order to find the actual level of interaction, we are going to use Google Analytic’s Event tracking:
In our example script, we categorise these particular events under ‘Carousel Slides’, then we register the action as the Slide/Tab number that was clicked. This is further qualified with the page’s title, so we can measure events interactions per page. For further information on the parameters to pass to Google’s page trackers, the developer docs will help you get started.

Google Analytics Events Tracking by Category

Google Analytics Events Tracking by Page
The above tables are obviously not an exhaustive list of how we can measure our events or virtual page views, but they provide examples to show that we are actually recording more of the user interactions.
The Devil is in the details
With the new statistics being recorded, we can counter some of the reports of high bounce rates against the fact that users are actually doing more before leaving – they are using some of our rich media components. Our extra scripts help us to understand how people actually view and use the page on a more granular level which helps us to better understand the actual browsing behaviour. By taking advantage of the extra features of Google Analytics such as Event Tracking and virtual page views, we are in a much stronger position to make informed choices on how we could improve the site based on the actual, real-world user experience.
We drive commercial value for our clients by creating experiences that engage and delight the people they touch.
Email us:
hello@nomensa.com
Call us:
+44 (0) 117 929 7333


